Written by: Stephan O’Brien, PhD (COMIT Reserach Scientist)
I participated in the second leg of the seabed mapping project tasked with acquiring bathymetric data at Blake Plateau, South Carolina. The National Oceanic and Atmospheric Administration’s Office of Coast Survey (NOAA OCS) was the lead agency for this project. The main objective of the venture was to update the Blake Plateau’s existing nautical charts and enhance maritime safety in the region. The second objective was to provide a training opportunity to students attending University of South Florida, University of New Hampshire, and the College of Charleston. Students and staff members from the three universities accompanied OCS personnel aboard the Nancy Foster for the mapping exercise. My main roles were to provide guidance to the students about hydrographic surveying, and to obtain a better understanding of the data collection workflow adopted by OCS.
Seabed mapping is a lot more than just acquiring and processing bathymetric data. This was the first time a number of our students participated in a research cruise and there was a lot of new information to assimilate, including the work environment aboard a vessel. For example, the waves increased during the transit from Charleston to Blake Plateau which resulted in an uncomfortable period on the vessel. I ensured the students had some understanding of how to cope with the rough conditions during the first few hours aboard the vessel. This included moving to the lowest deck on the vessel, taking motion sickness medication and eating saltine crackers. Students had to get accustomed to the periodic rocking of the vessel even during calmer conditions.
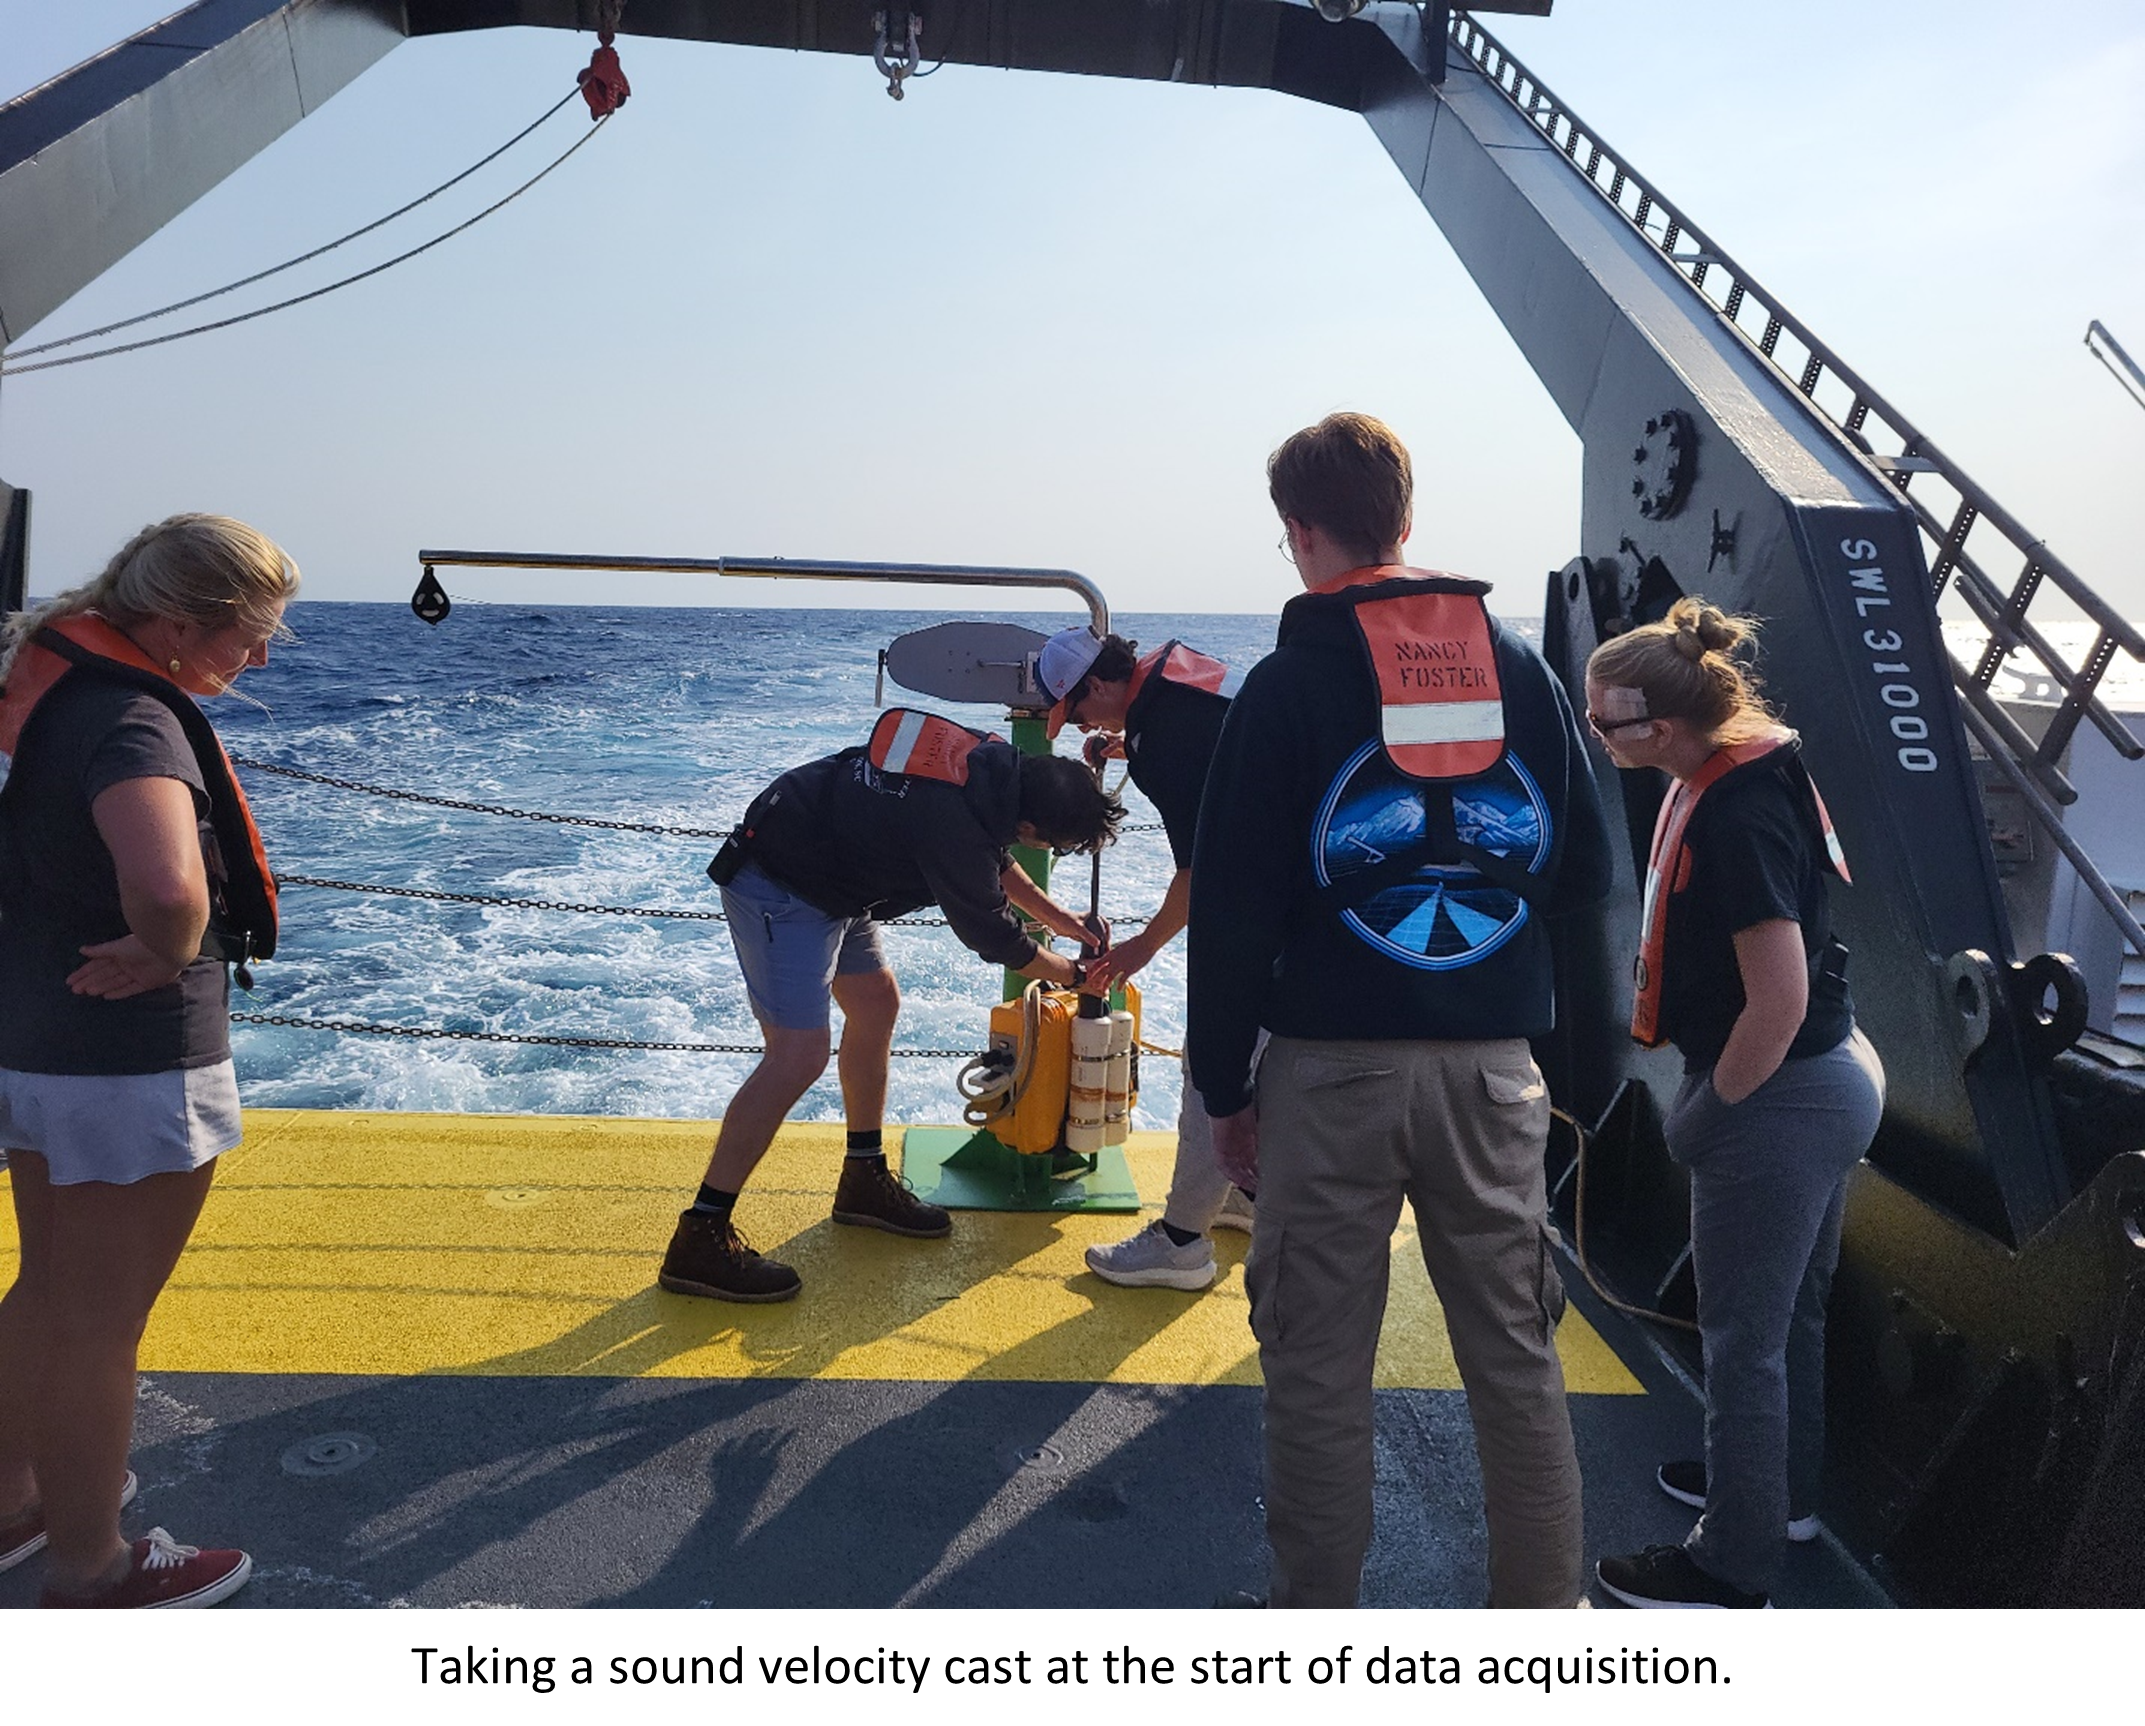
The rough conditions dissipated early the following morning and resulted in calmer sea conditions. The first sound velocity profile (SVP) was acquired at the start of multibeam data acquisition. These SVPs are measured from the surface to a few meters above the seabed and applied to the depth measurements and are taken throughout the survey. The sound waves emitted by the multibeam sonar change direction as the sound velocity varies with depth. These profiles correct the measurements and eliminate the effects of refraction. A sensor known as an Inertial Motion Unit measures the movement of the vessel in three-dimensional space. The motion of the vessel gets subtracted from the depth measurements to deduce the depth of the seabed directly below the vessel.

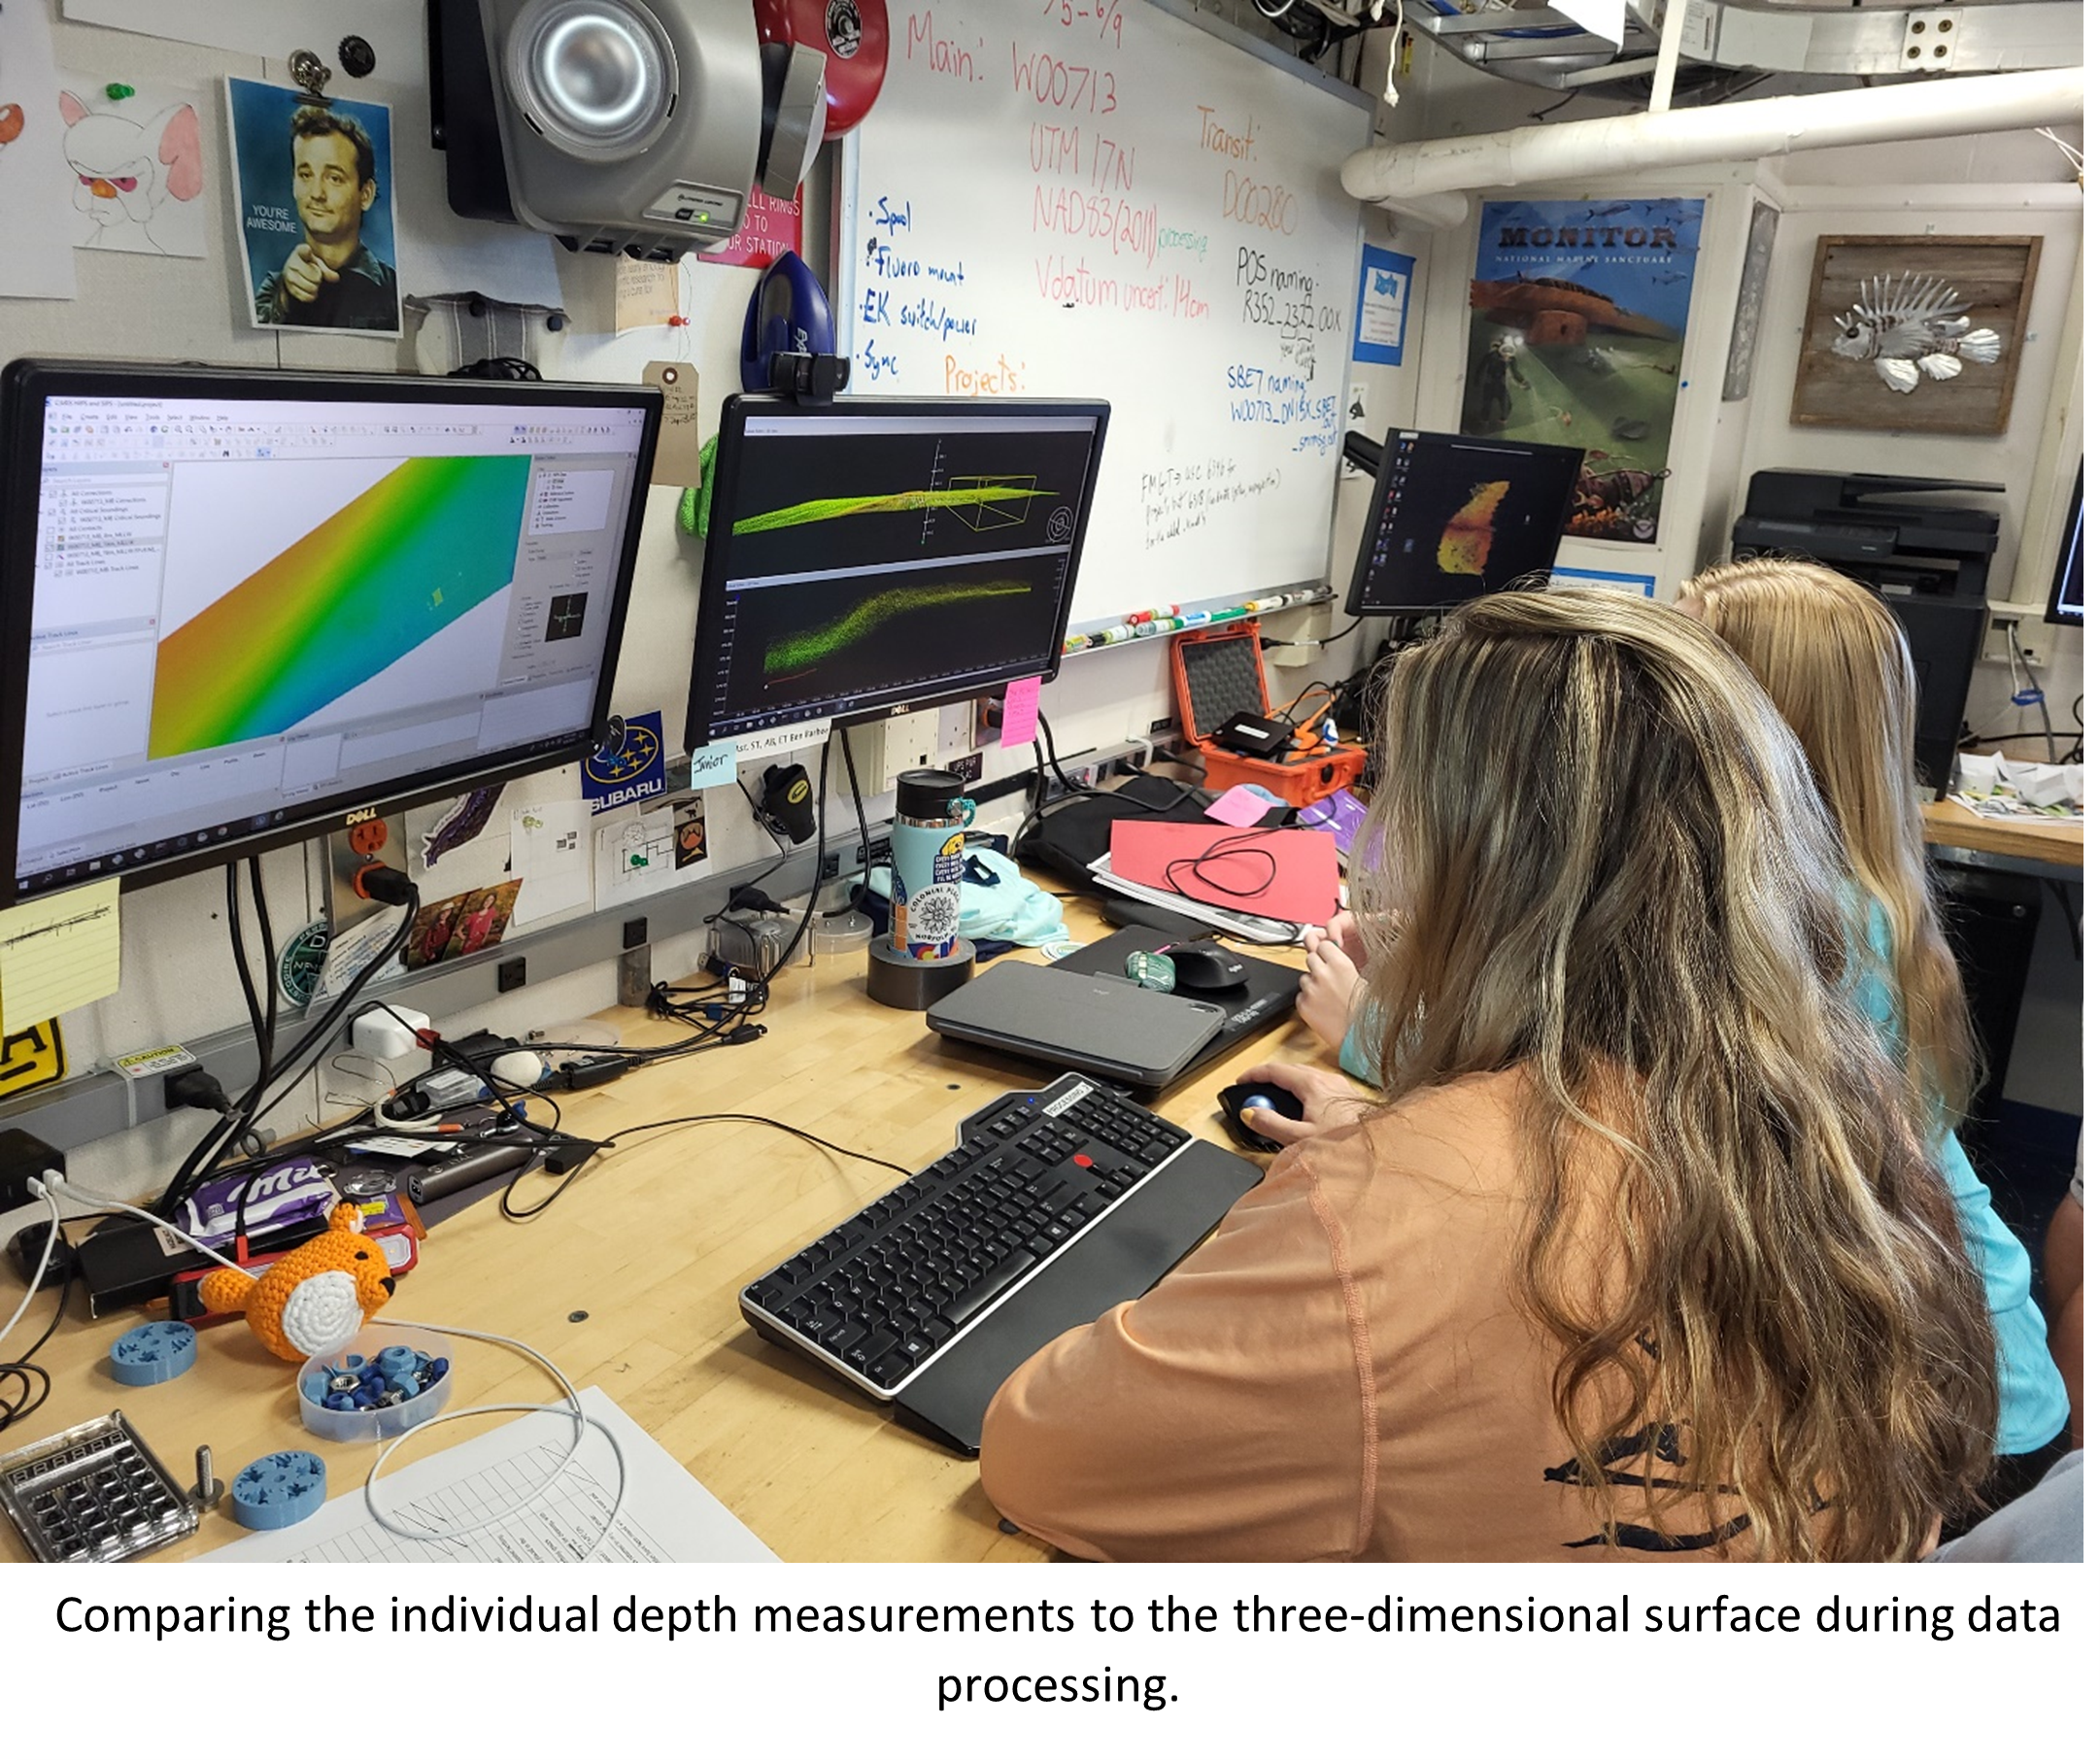
Multibeam data were processed at the end of each day. Bathymetric data processing and data acquisition occurred simultaneously for the duration of the survey. This supported efficient data collection and processing workflows on the vessel. After the corrections were applied to the multibeam data, the next step was to generate a preliminary three-dimensional surface using the acquired depths. The preliminary surface is a useful tool to identify incorrect depth measurements present in the data. For example, there may be depth measurements located a few meters above a predominantly flat area within the three-dimensional surface. This may suggest the shallower depth measurements are incorrect and should be removed from the compiled data.
The three-dimensional surface was reviewed by the Chief Scientist, Julia Wallace, after the surface was thoroughly cleaned. Julia is very experienced and easily identified any discrepancies with the data. The issues present in the three-dimensional surface were rectified before a final three-dimensional bathymetric surface was generated. The bathymetric surface was used by OCS to update the existing paper nautical charts and digital nautical charts. The use of advanced survey equipment on the vessel resulted in more accurate positions and depths on the charts, thus improving vessel navigation in the area.
The level of teamwork aboard Nancy Foster was strong throughout the cruise and is well highlighted in a specific experience that has stuck with me. During data acquisition on one of the survey lines, the bow of the vessel appeared to be oriented approximately 30◦ to the direction of the vessel transit. Increased wind and ocean currents can orient the bow of the vessel a few degrees from the direction the vessel is travelling, colloquially known as “crabbing.” The 30◦ orientation was visible on the data acquisition display but did not appear on the navigation display in the bridge leading to some confusion. The team on the bridge correctly deduced the navigation display was correct and the data acquisition software was incorrect. The survey team utilized a process of elimination to confirm the error was present in the survey navigation software, and the survey software required a reboot. There was a bit of good-natured banter between the survey team and bridge team after the issue was resolved, but the morale remained high among the teams. The entire process displayed the level of trust and respect the bridge team had for the survey team and vice versa.
The students weren’t the only ones who had an educational experience aboard the Nancy Foster – I too found myself in a learning space despite having been on several hydrographic surveys at this point in my career. I learned about the ancillary software utilized to partially automate the data processing workflow and gained further insight into the data collection workflow adopted by OCS. I also had the opportunity to mentor and guide students from three colleges during the practical experience aboard Nancy Foster. Hopefully the trip inspired some of the students to pursue a career in Hydrography.


Recent Comments