|
||||||||||||||||||||||||||||||||||||||||||||||||||||||||||||
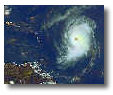
| Saffir-Simpson Intensity Scale | ||||||||||||||||||||||||||||||||||||||||||||||||||||||||||||
|
||||||||||||||||||||||||||||||||||||||||||||||||||||||||||||
| In the past 34 years, there have been more than 22,800 tornadoes that
cut an average swath 0.3 mile long by 0.1 mile wide (=684 sq. mi. of devastation,
or about half the size of Rhode Island destroyed).
Florida has the highest annual average number of tornadoes per 10,000 square miles (8.4). Florida does not have the most destructive tornadoes, however; most register F0 or F1 on the Fujita Tornado Intensity Scale. (By comparison, the "tornado alley" states have between 3 and 7.5 tornadoes but they are often more destructive). Florida's previous record of 97 tornadoes/year in 1975 was broken in 1997 (115 tornadoes). A "super outbreak" of 148 tornadoes on April 3 and 4, 1974 killed 316 people and caused $310 million in damages in 13 states. "Tornado Alley" is an area of the central U.S. where low-level moisture from the Gulf of Mexico runs under cooled, upper-level air from the Rocky Mountains, which imparts a spin to the unstable, but energetic atmosphere. |
||||||||||||||||||||||||||||||||
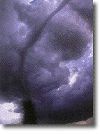
| Fujita Tornado Intensity Scale | ||||||||||||||||||||||||||||||||
|
||||||||||||||||||||||||||||||||
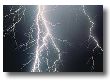
- There are up to 10 million strikes per day in the earth's atmosphere (=100/sec!). Of these, 90% are cloud-to-cloud flashes that never reach the ground.
- The average stroke is incredibly powerful - up to 30 million volts at 100,000 amperes flowing in 1/10 of a second.
- If you count the seconds between the flash and the thunder and divide by five, that is how many miles the strike was from you.
- Each year, over 1000 people are killed by lightning worldwide, about 200 in the U.S.
- From 1940 - 1981, lightning killed more people (7,761) than tornadoes (5,268), floods (4,481), or hurricanes (1,923).
- On July 17, 1940, lightning started 335 fires in the western U.S.
- "Lightning Alley" stretches across northern central Florida
- In 1753, Ben Franklin first described how to protect houses with a Lightning Rod.
- Jakarta, Indonesia is the lightning capital of the world.
Lightning:
- Costs the United States over $1 billion in annual damages.
- Is responsible for $2 billion in annual airline operating costs and passenger delays.
- Causes 30% of all electric outages which cost utilities about $100 million a year.
- Ignites half of all U.S. forest fires, resulting in $100 million of damage each year.
- Starts 26,000 house fires every year, costing about $147 million.
- Generates 5% of all residential insurance claims, ~ $1 billion of loss per year.
- Is responsible for 61% of all accidents caused by natural events.
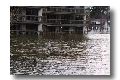
- The Mississippi River flood of 1993 destroyed 1500 homes and left 58 dead after 23 days of rising water covering four states. The Missouri River was 20 miles wide at peak flood and 5 feet higher than ever at St. Louis. Three-fourths of all the levees failed.
- In 1997, 43 major floods in 27 states flooded over 2000 square miles, killed 117 people, caused over 6 billion in damages, created 127,064 victims, and displaced 49,424 families.
- An average of 138 people/year are caught and killed in flash floods.
- The deadliest US flood disaster occured in Johnstown, PA in 1889 when a dam burst. A wall of water 150 feet high flooded for one hour downstream until it reached the town; 2209 people died.
- Worldwide between 1947 and 1967 more than 173,000 people died in floods. Flooding accounts for almost one quarter of the weather-related deaths. In the last ten years, floods have cost the U.S. $3.1 million billion annually in damages.
- Walls of water up to 100 feet high, moving as fast as a jet, are caused by underwater earthquakes, volcanoes and landslides.
- The Chilean quake of 1960 destroyed Hilo, Hawaii and left 61 dead.
- The Alaskan earthquake of 1964 spawned a tsunami up to 100 feet high along the Alaskan coast that left 122 dead and caused $106 million in damages.
- The Alaskan earthquake of 1946 destroyed downtown Hilo with a 25 foot high wave, 96 people died.
- Western Pacific islands (inc. Japan and New Guinea) have been hit by dozens of Tsunamis this century).
- The Richter Scale describes the magnitudes (heights) of seismic waves measured by a seismograph. This is a logarithmic scale; an earthquake of magnitude 4 is 10 times as powerful as a magnitude 3 quake. The biggest quake ever recorded on this scale was the 8.9 Chilean quake of 1960.
- The Mercalli Scale is used to compare modern quakes to those that occurred before the seismograph was invented, and is essentially a measure of the amount of damage the quake caused on a scale of 1 to 12 (in Roman numerals). A Mercalli III quake rattles windows; a Mercalli XII quake causes total devastation.
| Most Fatal Earthquakes | Date | Deaths |
| Shansi, China | 1556 | 830,000 |
| Calcutta, India | 1737 | 300,000 |
| Tangshan, China | 1976 | 255,000 |
| Aleppo, Syria | 1138 | 230,000 |
| Damghan, Iran | 856 | 200,000 |
| Gansu, China | 1920 | 200,000 |
| Xining, China | 1927 | 200,000 |
| Ardabil, Iran | 893 | 150,000 |
| Kwanto, Japan | 1923 | 144,000 |
| Messina, Italy | 1908 | 100,000 |
|
Recent devastating earthquakes
|
||
|
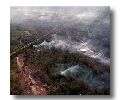
- In 1998, 9 fires burned 1.7 million acres in Yellowstone National Park (40% of the park).
- In 1991, a firestorm in Oakland, CA caused 25 deaths and $2.5 billion in damages.
- In 1993, 323 buildings were destroyed in Malibu, CA leaving 3 dead.
- In 1996, 6 million acres in the U.S. burned, 65,000 in Yosemite National Park.
- In 1998, 2300 wildfires burned 1/2 million acres and displaced 10,000 people in Florida.
- In April 1999, more than 130,000 acres and 50 homes were also destroyed in Florida.
Predicting (from Wildland Fire Assessment System website
by USDA Forest Service) the Keetch-Byram Drought Index (KBDI) and the Lower
Atmosphere Stability Index (LASI) are used by fire watchers to predict
fire potential by region.
The KBDI is a soil/duff drought index that ranges from 0 (no drought)
to 800 (extreme drought) and is based on a soil capacity of 8 inches of
water. Factors in the index are maximum daily temperature, daily precipitation,
antecedent precipitation, and annual precipitation.
| KBDI | |
| 0 - 200 | Soil moisture and large class fuel moistures are high and do not contribute much to fire intensity. Typical of spring dormant season following winter precipitation. |
| 200 - 400 | Typical of late spring, early growing season. Lower litter and duff layers are drying and beginning to contribute to fire intensity. |
| 400 - 600 | Typical of late summer, early fall. Lower litter and duff layers actively contribute to fire intensity and will burn actively. |
| 600 - 800 | Often associated with more severe drought with increased wildfire occurrence. Intense, deep burning fires with significant downwind spotting can be expected. Live fuels can also be expected to burn actively at these levels. |
The Lower Atmosphere Stability Index, or Haines index, is computed from the morning soundings from Radio Observation stations across North America. The index is composed of a stability term and a moisture term. The stability term is derived from the temperature difference at two atmosphere levels. The moisture term is derived from the dew point depression at a single atmosphere level. This index has been shown to be correlated with large fire growth on new and existing fires where surface winds do not dominate fire behavior.
The Haines Index ranges from 2 to 6 and indicates the potential for large fire growth:
- 2: very low potential--(moist stable lower atmosphere)
- 3: very low potential
- 4: low potential
- 5: moderate potential
- 6: high potential--(dry unstable lower atmosphere)
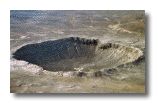
Theoretical Effects of Earth Impacting Asteroids
| Asteroid Diameter | Earth Impacts |
| <200 yards |
on land: multi-megaton blast in air, local damages
|
| 200 - 2000 yards |
on land: crater 10 miles wide, worldwide crop losses
|
| 1 - 10 miles |
on land: crater 100 miles across, dust cloud causes nuclear winter
|
| > 10 miles |
on land or sea: loss of most life forms due to long nuclear winter |
CLOSEST RECORDED APPROACHES
| Name | Date | Closest to Earth(miles/km2) |
| 1994 XL1 | Dec. 9, 1994 | 65,000 |
| 1993 KA2 | May 20, 1993 | 93,000 |
| 1991 BA | Jan 18, 1991 | 93,000 |
| 4581 Ascelpius | Mar 1, 1989 | 372,000 |
| Hermes | Oct 30, 1937 | 558,000 |